Blog · Engineering
What Is a HAR File? Structure, Export, and Analysis
TL;DR: A HAR file (HTTP Archive) is a JSON record of every network request and response a browser made during a session — URLs, headers, bodies, status codes, and timings. You export one from the DevTools Network tab, and you read it with a viewer, a script, or a tool built for the job.

What a HAR file is used for
Because a HAR captures the complete exchange from the client’s side, it answers questions that server logs cannot:
- Diagnosing slow page loads — the timings show exactly where each request spent its milliseconds
- Debugging failures you cannot reproduce — a capture from the affected user shows what their browser actually sent and received; see debugging with two HAR files
- Understanding which APIs a web app really calls — the raw material for turning a site’s private API into agent tools
The structure of a HAR file
HAR is plain JSON with a single top-level log object. Inside it, the entries array does almost all the work — one entry per request:
{
"log": {
  "version": "1.2",
  "creator": { "name": "WebInspector", "version": "537.36" },
  "pages": [{ "id": "page_1", "title": "https://example.com/" }],
  "entries": [
    {
      "startedDateTime": "2026-04-10T09:14:05.231Z",
      "time": 45.2,
      "request": {
        "method": "GET",
        "url": "https://example.com/api/v2/orders",
        "headers": [{ "name": "accept", "value": "application/json" }],
        "queryString": []
      },
      "response": {
        "status": 200,
        "headers": [{ "name": "content-type", "value": "application/json" }],
        "content": { "size": 1024, "mimeType": "application/json", "text": "..." }
      },
      "timings": { "blocked": 1.2, "dns": 0.5, "connect": 3.1, "send": 0.2, "wait": 38.0, "receive": 2.2 }
    }
  ]
}
}
The parts you will actually read:
| Field | What it tells you |
|---|---|
entries[].request | The method, URL, headers, and body the browser sent |
entries[].response | The status code, headers, and body that came back |
entries[].time + timings | Total duration, broken down into DNS, connect, wait, and receive |
pages | Page-level load events (onContentLoad, onLoad) |
To browse a capture visually, tools like HAR Viewer or network viewer render the JSON as a waterfall.
How to export a HAR file from Chrome DevTools
-
Open the Network tab in Chrome DevTools.
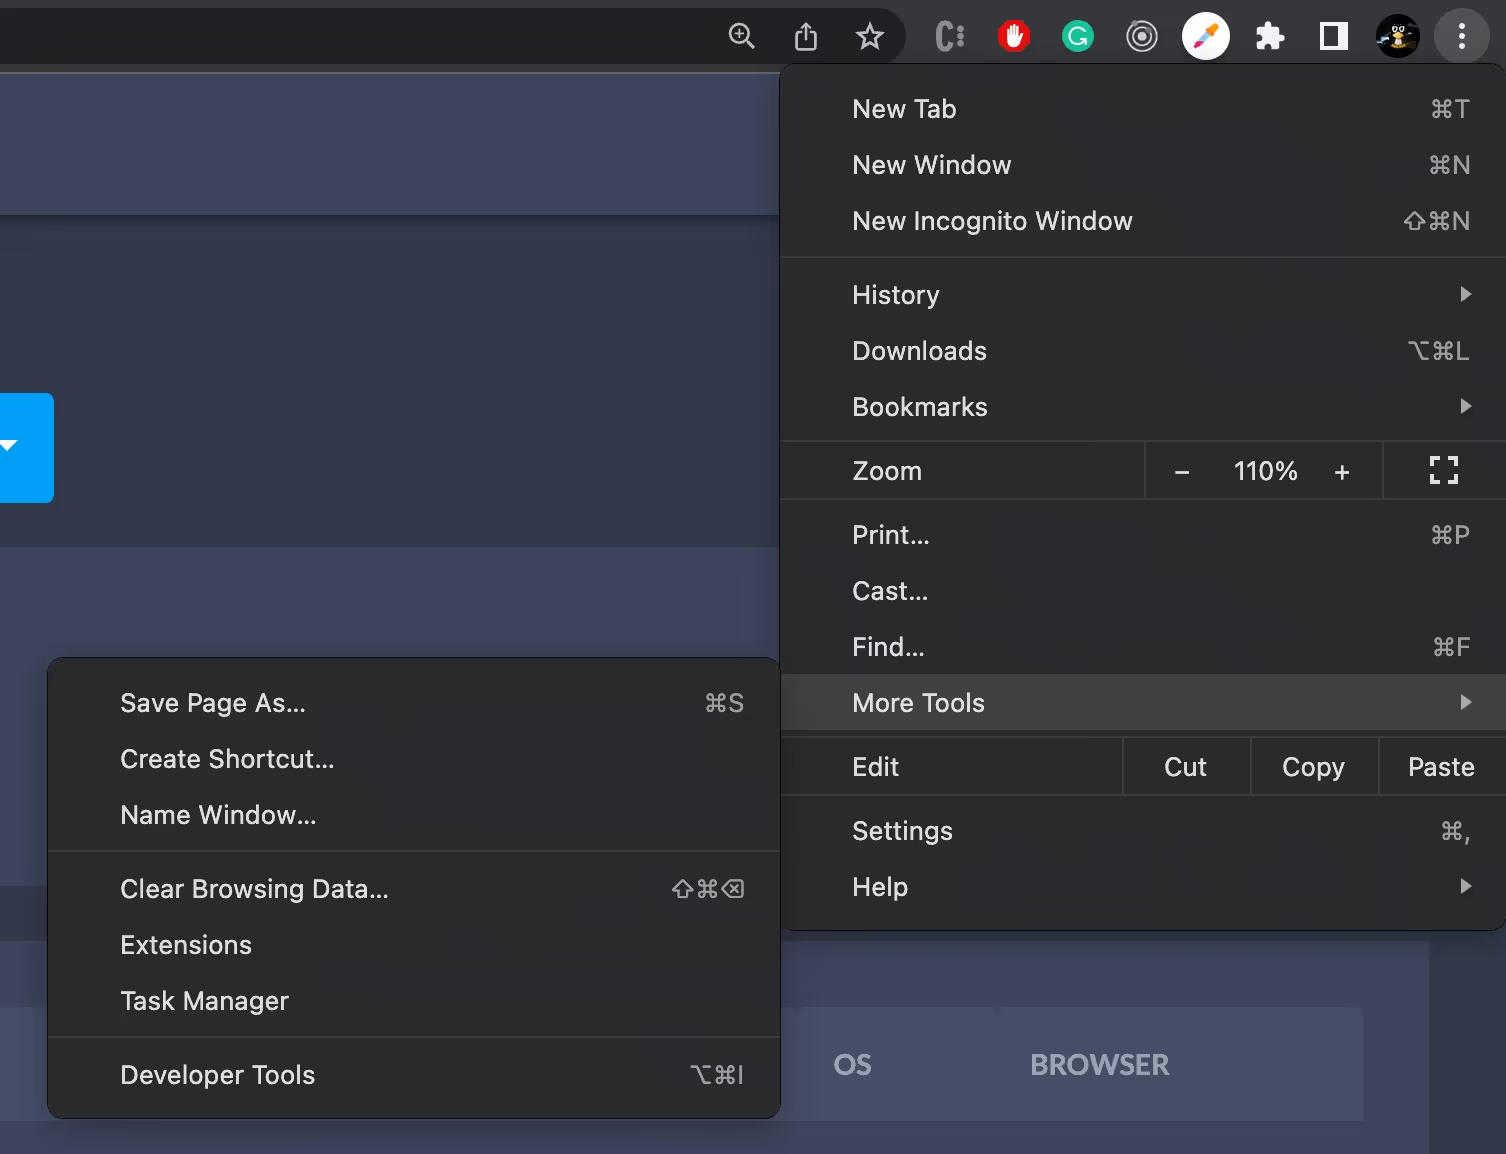
a] Open the Google Chrome browser
b] At the top right corner click Three Dots > More Tools > Developer Tools > Network tab
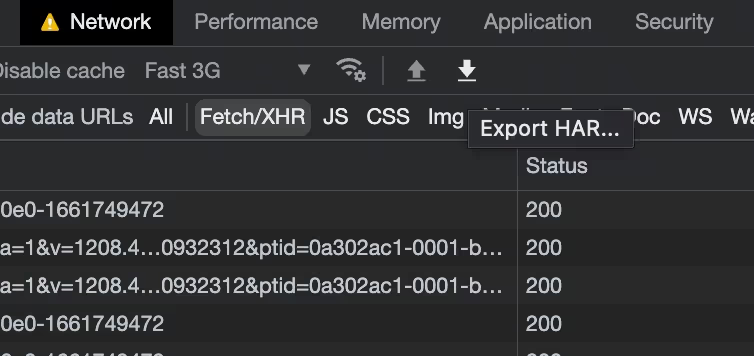
- In the Network tab, the small export icon (⬇️) downloads the current log as a HAR file.
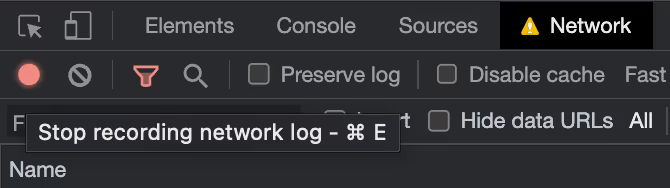
- To capture the page-load traffic itself, make sure network log recording is enabled — the red circle icon (🔴) means recording is on — then reload the page you want to analyze.
- That’s all — export the HAR file and you are ready to analyze it.
How to export a HAR file with sensitive data
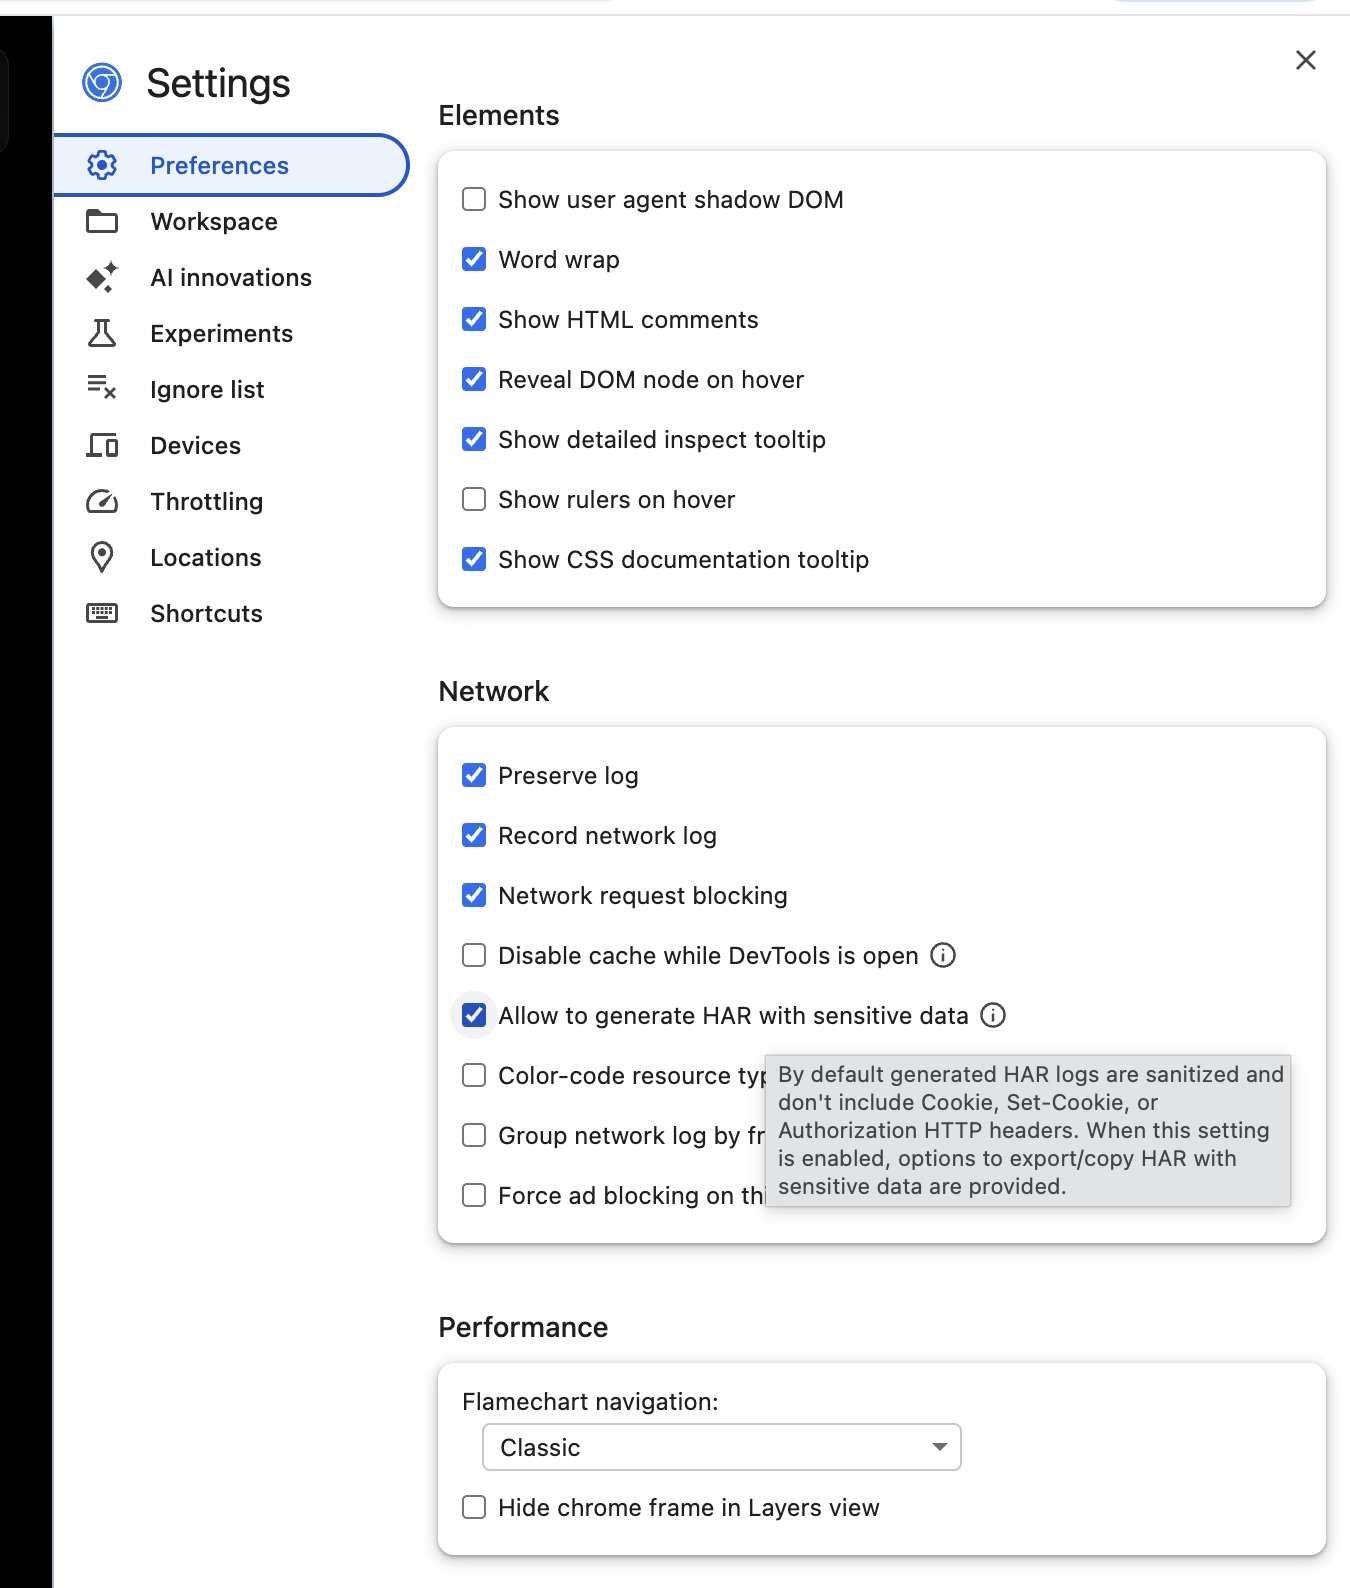
Chrome sanitizes HAR exports by default, so cookies, Set-Cookie, and Authorization headers may be excluded. If you need the full session data for debugging — for example, to trace an authentication flow — enable the sensitive data option before exporting:
-
Open Chrome DevTools and go to Settings.
-
In Preferences, scroll to the Network section.
-
Enable Allow to generate HAR with sensitive data.
-
Go back to the Network tab and reload the page so the requests are captured again.
-
Export the HAR file using the download icon. Chrome will now include the sensitive request data.
Warning: only export HAR files with sensitive data when necessary, and share them carefully. They can contain cookies, auth tokens, and private user information — effectively a live credential set for the account that captured them.
Frequently asked questions
What does HAR stand for? HTTP Archive. It is a JSON-based format for logging a browser’s HTTP transactions; version 1.2 is the one browsers export today.
How do I open a HAR file? It is plain JSON, so any text editor works. For something readable, drag the file into Chrome’s Network tab to re-import it, or use a dedicated viewer like HAR Viewer.
Are HAR files safe to share? Not by default. Chrome strips some sensitive headers on export, but request and response bodies are still included and can carry tokens or personal data. Scrub a capture before sharing it outside a trusted channel.
Do all browsers export HAR files? Yes — Chrome, Firefox, Edge, and Safari can all export a HAR from their developer tools, and the format is the same across them.
Exporting the file is the easy part; the value is in reading it. Start with diffing a working capture against a broken one — or upload a HAR to TraceMiner and ask it questions in plain language.
Keep reading
More guides and writeups from the TraceMiner blog.
How to Sanitize a HAR File (Chrome's Export Isn't Enough)
How to sanitize a HAR file before sharing it: what Chrome's sanitized export removes, what it leaves behind, and the tools that finish the job.
Read blog → DebuggingDebugging With HAR Files: Diff a Working vs Broken Capture
Debugging with HAR files: capture the flow twice, once working and once broken, diff the traces, and the first divergence is the cause. A practical method.
Read blog → AI AgentsHAR to MCP Server: Give Your AI Agent an API, Not a Browser
Turn a HAR file into an MCP server your Claude Code agent calls directly. Skip the headless browser: faster actions, lower cost, and no brittle selectors.
Read blog →